
Government of Canada; Environment and Climate Change Canada; Canadian Wildlife Service
Type of resources
Topics
Keywords
Contact for the resource
Provided by
Years
Formats
Representation types
Update frequencies
status
-
The Atlas of Pelagic Seabirds off the West Coast of Canada presents maps that display the distribution of 48 species of seabirds and two species pairs (i.e., Red-necked and Red Phalaropes, and Hawaiian and Galapagos Petrels). Seabird surveys were conducted aboard commercial and Canadian federal government ‘ships-of-opportunity’ from 1982-1983 and 1991-2005 within the study area (45° N to 58° N and from the coast to 148° W). Sightings of rare species that came from other sources (including some pre 1982 and post 2005) are also included in order to present as complete a picture as possible. For 33 species and one species pair, the average densities within 5’ latitude by 5’ longitude grid cells are displayed seasonally. The seabirds mapped in this manner include 11 species of Procellariiformes (albatrosses, fulmars, petrels, shearwaters and storm-petrels), and 24 species of Charadriiformes (phalaropes, skuas, gulls, terns and auks). The sighting locations for an additional 15 species and one species pair are also mapped. This group, comprised of 10 species of Procellariiformes and seven species of Charadriiformes includes species that are relatively uncommon to rare in the study area (but previously documented); and species that are extremely rare and/or have not been documented and thus remain unconfirmed. These data may be used to generate presence/absence and trends in and estimates of relative abundance. These data can also be used to examine patterns in temporal and spatial distribution. However, due to the opportunistic nature of the surveys, both in space and time, these data should not be used to determine absolute abundance. The rationale for developing this atlas was the recognized need for a product that could assist with: coastal zone and conservation area planning; emergency response to environmental emergencies; and identification of areas of potential interactions between seabirds and anthropogenic activities. In addition, the data used to develop the document provides a baseline to compare with future seabird distributions in order to measure the impacts of shifts in composition, abundance and/or distribution of prey, and climatic and oceanographic changes.
-

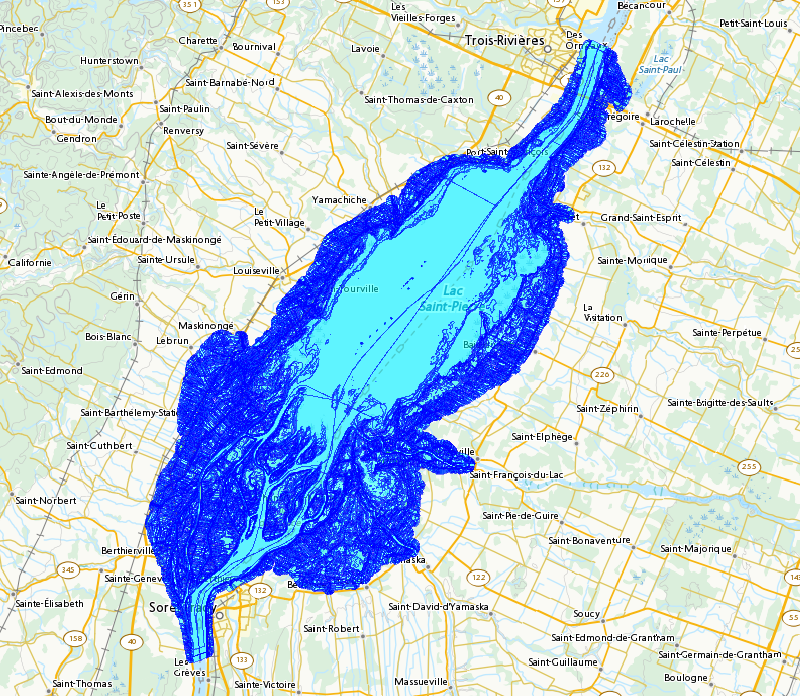
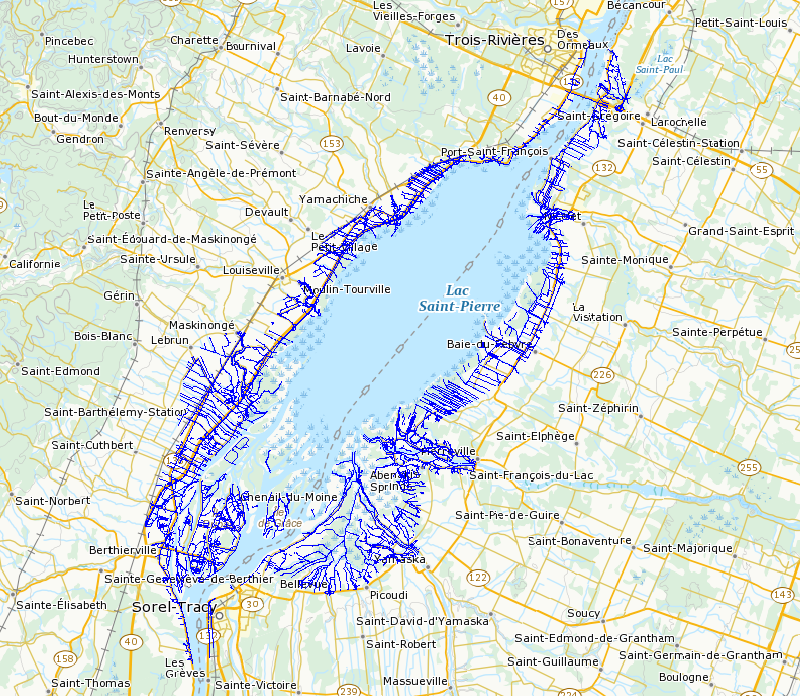
Recent efforts to model spring breeding habitats of fish in the St. Lawrence have revealed significant gaps in land use descriptions for the floodplains of Lac Saint-Pierre. In order to fill these gaps, aerial photographs taken in 1950, 1964 and 1997 were assembled in mosaic fashion and then digitized, georeferenced and interpreted to categorize 28 fish habitat classes. For each of the three periods, interpretation made it possible to categorize and georeference polygons (e.g. wet meadows, perennial crops) and linear elements (e.g. windbreaks, riparian strips, roads) and to compile these with their properties (habitat class, length, perimeter, surface area). To facilitate and refine subsequent analyses, all polygons and linear elements were delineated with the aid of several layers of information, including the boundaries of regional county municipalities, drainage basins, several flood scenarios, and three large units: the north and south shores of Lac Saint-Pierre and the Sorel archipelago. This report describes the methods used and the constraints encountered; it also presents certain interpretation limits and a summary analysis of habitat classes in the three periods studied. A temporal trend analysis of habitat dynamics in the three periods has yet to be completed. Source files containing the data have been published and are available to anyone interested in land use in the floodplains of Lac Saint-Pierre or wishing to extend the study of changes in these landscapes and habitats over the past fifty years, depending on their field of interest (e.g. fish habitats, waterfowl nesting, agricultural landscape).
-
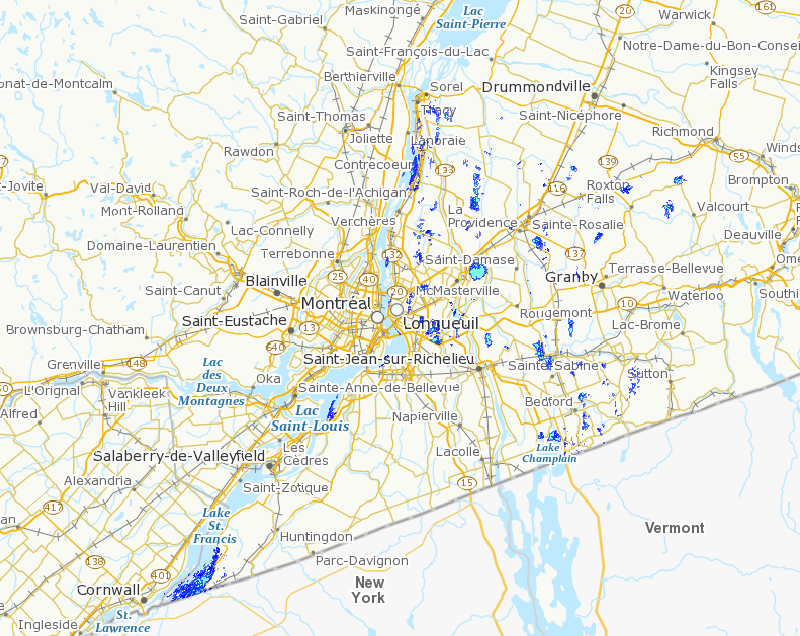
With the aid of aerial photographs from 2006 and the stereoscopic principle, the wetlands of Montérégie were mapped in 2007 as part of a project of the Monteregie Geomatics Agency (GéoMont). The Canadian Wildlife Service had indicated that it needed more up-to-date maps of the wetlands in the region, as well as the ability to evaluate the evolution of these environments to their present condition. Consequently, GéoMont was given a mandate to map the changes in wetlands in Montérégie. The goal of the project was to map the changes that took place in the wetlands of Montérégie between 1964 and 2006. This included: the mapping and statistical analysis of changes in the following protected areas: - Îles de Contrecoeur National Wildlife Area - Îles de la Paix National Wildlife Area - Lac Saint-François National Wildlife Area - Mont Saint-Hilaire Migratory Bird Sanctuary - Couvée Islands Migratory Bird Sanctuary - Île aux Hérons Migratory Bird Sanctuary - Philipsburg Migratory Bird Sanctuary Also part of the project was the mapping and statistical analysis of changes in a hundred-odd sectors throughout the territory of Montérégie on the basis of a remote sensing inventory produced by the Canadian Wildlife Service. A number of recommendations were also made with respect to the monitoring of wetlands using geomatic capabilities.
-
Designated as a Species of Special Concern in 2008, the entire range and potential area of occupancy for the Great Blue Heron is defined as terrestrial areas within the Coastal Douglas Fir and Coastal Western Hemlock Biogeoclimatic zones that are less than 10 km from a potential foraging area (potential foraging areas are defined as the entire coastline and major river systems). The distribution of the Pacific Great Blue Heron is confined to the coast from Prince William Sound, Alaska south to Puget Sound, Washington. The major factors currently limiting the persistence of heron populations are nesting failure and reduced nesting productivity arising from eagle predation, human disturbance and habitat declines from development. Refer to the, "COSEWIC Assessment and Update Status Report on the Great Blue Heron (Ardea herodias fannini) in Canada," for more information.
-
Recent efforts to model spring breeding habitats of fish in the St. Lawrence have revealed significant gaps in land use descriptions for the floodplains of Lac Saint-Pierre. In order to fill these gaps, aerial photographs taken in 1950, 1964 and 1997 were assembled in mosaic fashion and then digitized, georeferenced and interpreted to categorize 28 fish habitat classes. For each of the three periods, interpretation made it possible to categorize and georeference polygons (e.g. wet meadows, perennial crops) and linear elements (e.g. windbreaks, riparian strips, roads) and to compile these with their properties (habitat class, length, perimeter, surface area). To facilitate and refine subsequent analyses, all polygons and linear elements were delineated with the aid of several layers of information, including the boundaries of regional county municipalities, drainage basins, several flood scenarios, and three large units: the north and south shores of Lac Saint-Pierre and the Sorel archipelago. This report describes the methods used and the constraints encountered; it also presents certain interpretation limits and a summary analysis of habitat classes in the three periods studied. A temporal trend analysis of habitat dynamics in the three periods has yet to be completed. Source files containing the data have been published and are available to anyone interested in land use in the floodplains of Lac Saint-Pierre or wishing to extend the study of changes in these landscapes and habitats over the past fifty years, depending on their field of interest (e.g. fish habitats, waterfowl nesting, agricultural landscape).